A heat map is like a stadium seating chart where seat size represents how many people sit there, while shading shows whether the crowd grew or shrank. Size and change answer different questions. Confusing them is the first reading error.
Your eye usually finds the largest rectangle first. In StockTitan's stock-market heat map, tiles are grouped by sector and industry, sized by market capitalization, and colored by daily percentage change, while sector aggregates are market-cap weighted. A large tile therefore signals economic weight within the displayed universe, not necessarily an unusually strong return.
Say the largest company in a sector rises while smaller companies decline. Its weight may still leave the sector summary positive. The equivalent crypto scenario is a Bitcoin- or Ethereum-heavy grouping whose aggregate performance looks healthy even as smaller assets weaken.
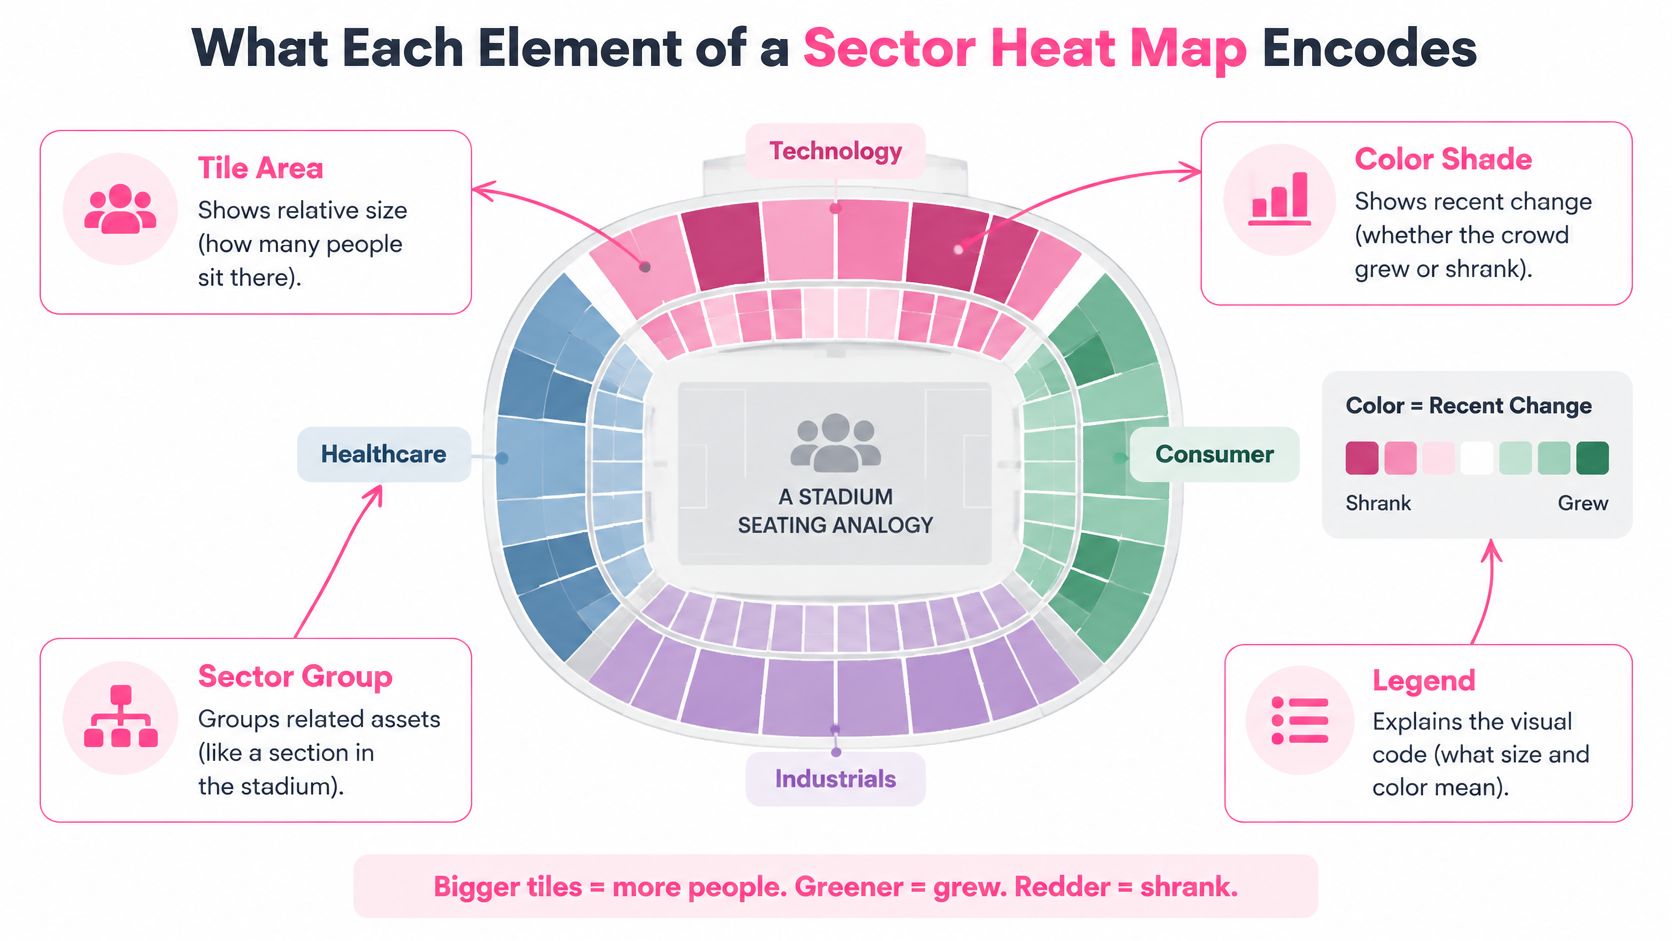
Visual encoding determines how the dashboard draws an asset. Performance aggregation determines how it combines constituent returns. A map can display individual tiles accurately yet encourage a misleading sector-level conclusion if readers assume the summary represents the typical member.
Before interpreting any tile, name what its size, color, and period mean.
What each heat map element encodes
| Element |
What it encodes |
What it does not show |
| Tile area |
Constituent market capitalization |
How many assets sit behind the tile |
| Tile color |
Percentage return over the chosen period |
Why the price moved |
| Sector group |
Classification assigned to each asset |
Whether the asset truly fits that group |
| Sector summary return |
Market-cap-weighted return of its constituents |
Breadth of gains across members |
| Lookback window |
The start and end dates of the return |
Behavior in other periods |
Read the legend before comparing shades. Check whether colors represent absolute returns or performance relative to a benchmark, and whether the scale stays fixed when you switch screens.
A trustworthy dashboard should also disclose its benchmark, weighting convention, missing-price treatment, and whether returns are price-only or total-return. Without those details, comparisons can mix different calculations.
Don't transfer visual assumptions between tools, either. MemeAssist's bubble map guide for Solana traders is a useful companion when moving to a different visualization: establish what its shapes and relationships encode before interpreting them as market performance.
Today's color answers a narrow question. It doesn't establish that traders have persistently favored a sector, or that the sector has beaten the wider market.
Use a sector-by-time matrix instead. Compare daily reaction, short-term follow-through, monthly persistence, and year-to-date leadership, with every return measured against the same benchmark. Then add volatility-adjusted momentum and member participation.
What each time horizon reveals and where it misleads
| Horizon or metric |
What it reveals |
Misleading when used alone |
| 1-day excess return vs benchmark |
Immediate reaction to news or flows |
One-day reversals and single-news shocks |
| 5-day excess return vs benchmark |
Short-term follow-through |
A single volatile week |
| 20-day excess return vs benchmark |
Whether a move persists for a month |
A trend already priced in |
| Year-to-date excess return vs benchmark |
Long-run leadership |
Leadership that faded months ago |
| Volatility-adjusted momentum |
Return earned per unit of risk |
Low-volatility sectors looking stronger than they are |
| Cross-sectional breadth |
Share of members moving up |
Small sectors with few members swinging sharply |
These are proposed dashboard settings, not a promise that a particular window predicts returns. Their purpose is to expose contradictions that a daily screen conceals.
For a practical research ranking, divide rolling excess return by realized volatility, using aligned observations. Keep the calculation consistent across sectors and avoid treating a near-zero volatility denominator as meaningful strength.
Apply turnover limits so minor ranking changes don't force repeated portfolio changes. Require breadth or volume confirmation before promoting a color transition into an actionable candidate.
The S&P Dow Jones Indices sector-rotation methodology illustrates how much structure can sit behind sector selection: it retains the five sectors with the highest value scores, then selects the three highest-momentum sectors among them. That's a defined selection process, not a rule to buy whichever tile looks strongest.
Practical rule: A positive daily reading against a negative monthly reading is an unconfirmed reaction, not sufficient evidence of rotation.
Require agreement across distinct horizons before calling the move persistent. Also examine whether apparently different winning buckets hold related exposures. Otherwise, selecting several green categories may concentrate the same underlying risk rather than diversify it.
A bright sector tile can be an accurate calculation and a poor description of its members. Weighted strength and broad strength aren't interchangeable.
In the recent dataset described by Schwab's stock-sector outlook, Information Technology represented 39.7% of the S&P 500, while its three largest stocks accounted for 56.6% of the sector and its ten largest accounted for 76.6%. Those figures describe that dataset, not permanent index weights.
Concentration figures from a recent sector dataset
| Measure |
Value |
What it tells you |
| Information Technology share of the S&P 500 |
39.7% |
One sector can dominate an index-level view |
| Three largest stocks as share of the sector |
56.6% |
A few names can dominate the sector calculation |
| Ten largest stocks as share of the sector |
76.6% |
Most sector weight sits in a limited group |
The important distinction is that concentrated weights don't prove narrow participation. They establish the possibility of distortion. You still need constituent returns to determine whether the smaller members joined the advance.
For crypto categories, inspect the contribution of the largest tokens rather than assuming a category label distributes exposure evenly. A broad-sounding name can still describe a concentrated basket.
Pair the weighted result with diagnostics that answer separate questions:
- Equal-weight return: How did the average member perform when each received the same influence?
- Advance/decline breadth: Were more members rising than falling?
- Median return: What happened to the middle constituent, without letting extreme returns dominate?
- Dispersion: Were members moving together or producing widely separated outcomes?
- Volatility and excess return: Was the apparent leadership erratic, and did it beat the benchmark?
A wide gap between cap-weighted and equal-weighted performance is a reason to inspect constituent contributions. Don't automatically attribute the entire gap to a particular token without checking its weight and return.
High dispersion deserves separate attention. A positive average can combine strong winners with meaningful losers, making the sector label a weak guide to individual trade selection. The practical use of market breadth metrics for anticipating volatility is to investigate participation before relying on the headline.
Call leadership broad only when the weightings tell compatible stories, most members participate, and dispersion isn't dominated by outliers. Set those standards against the bucket's own history rather than inventing a universal cutoff.
Consider a hypothetical crypto-mining company that also sells computing capacity for artificial-intelligence workloads. A standard sector map must place it somewhere, but a trader studying compute demand may reasonably compare it with businesses outside that assigned sector.
The MSCI GICS methodology uses a hierarchical framework in which each company receives a grouping at each level, generally based on the business activity generating more than 60% of revenue; diversified businesses may receive conglomerate or multi-sector-holdings classifications. That creates a consistent organizational system, not a complete map of every economic exposure.
A single label can omit relevant peers. Equally, placing a business in every plausible theme can exaggerate how many independent opportunities exist.
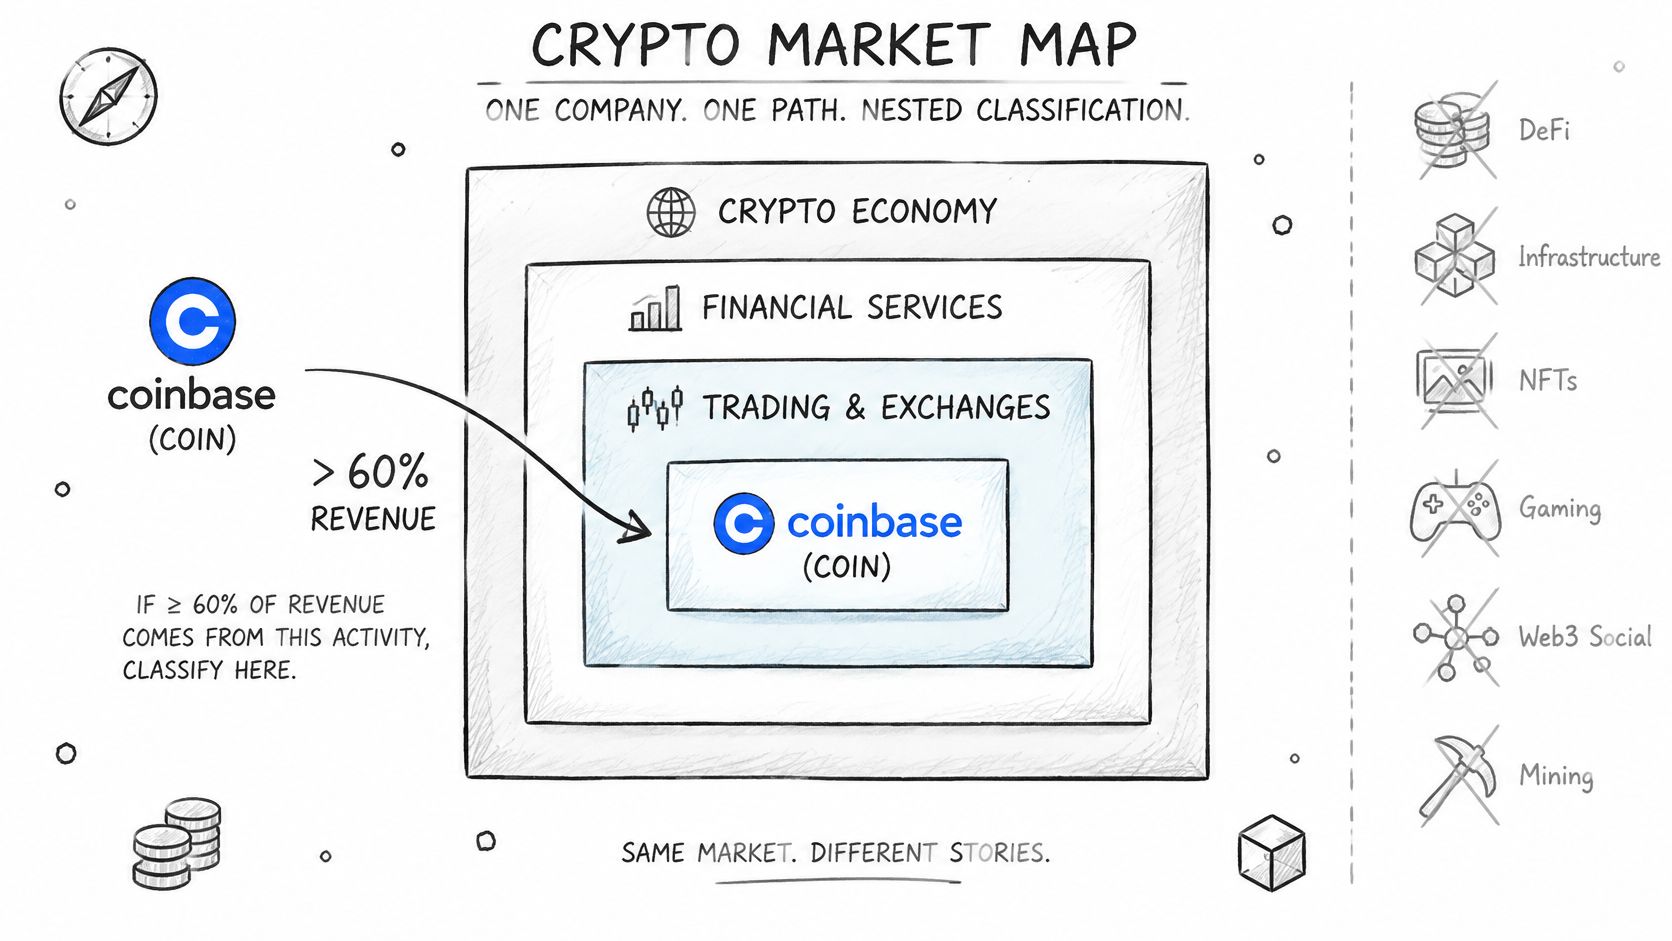
Use a standard sector view for stable comparisons and an economic-exposure view for the question you're researching. Overlapping circles are a better mental model for the latter: payments, lending, cloud infrastructure, gaming, and crypto activity needn't form mutually exclusive businesses.
For example, a hypothetical exchange offering payments and lending would have several business exposures. A gaming-related token may have a different relationship to gaming economics than an equity whose issuer earns gaming revenue. Don't treat those relationships as equivalent merely because both fit the same narrative.
Document the distinction explicitly:
- Classification date: Record when the assignment was reviewed.
- Revenue weights: Use disclosed business exposure where available, rather than inferring it from branding.
- Overlap: Identify assets included in multiple thematic groups.
- Reclassification rules: Specify what business-model change triggers reassignment.
For tokens without comparable corporate revenue disclosures, use clearly labeled exposure criteria rather than fabricated revenue weights. Describe what connects the asset to the theme and what would invalidate that connection.
A structured approach to trading DeFi narratives should separate thematic relevance from the mechanism through which a token might benefit. Participation in an ecosystem isn't automatically economic exposure to every successful business within it.
Trust standard grouping when you need reproducible sector comparisons. Use thematic grouping when the investment question concerns a shared demand driver, but retain the overlap disclosures so the apparent opportunity set doesn't become inflated.
Build the calculation sheet before choosing colors. A reproducible map starts with written definitions, aligned timestamps, and a return series you can inspect outside the visualization.
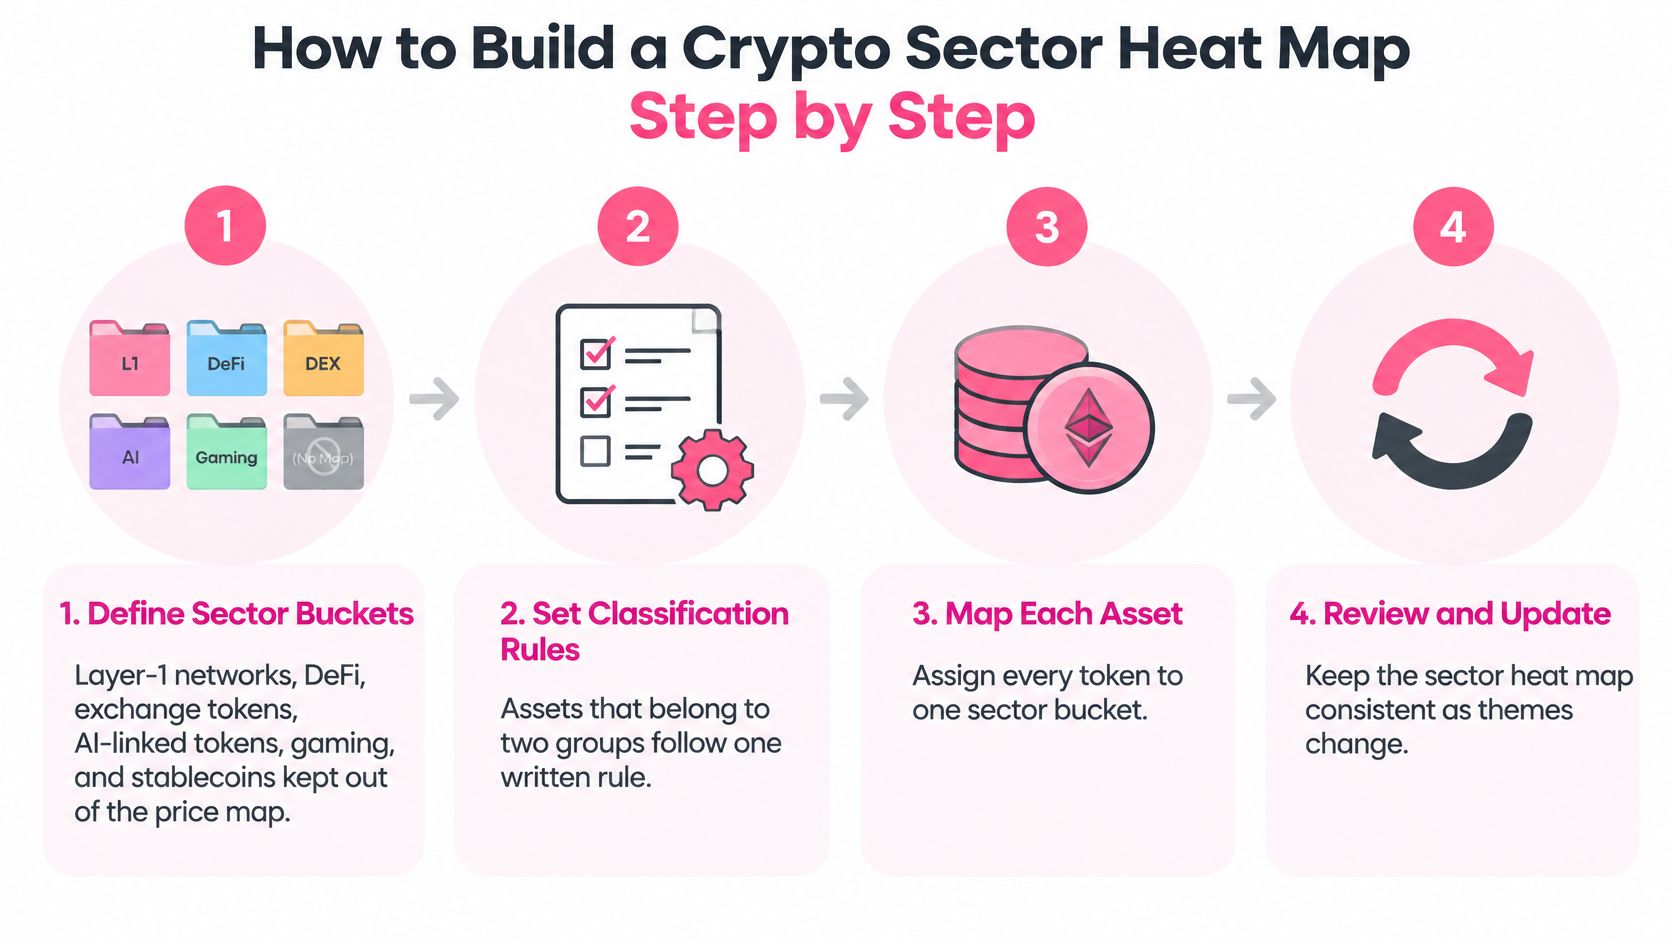
The classification workflow establishes consistency before performance is calculated.
-
Write the bucket rules. Define layer-1 networks, DeFi, exchange tokens, AI-linked tokens, and gaming by explicit inclusion criteria. Keep stablecoins outside this directional price map, and choose a primary assignment rule for assets that qualify for overlapping buckets.
-
Choose the benchmark. Use Bitcoin if the question is whether sectors outperform Bitcoin, or a documented broad crypto index for wider market-relative analysis. Changing benchmarks mid-review would change the question rather than improve the answer.
-
Fix the observation schedule. Use the daily, weekly, monthly, and year-to-date windows shown in the horizon matrix, all ending at the same snapshot. Define a daily close timestamp and time zone instead of allowing exchange defaults to determine your comparisons.
-
Calculate both weightings. Use constituent weights fixed at the beginning of the measurement period, or a documented rebalancing method, for the cap-weighted series. Compute the equal-weight series from the same eligible constituents so universe differences don't masquerade as concentration.
-
Handle missing prices explicitly. Prefer flagging incomplete observations and excluding them under a consistent eligibility rule; if you carry forward a last price, mark it stale. Silent carry-forwards can make an unavailable asset appear unchanged.
-
Rank with a risk adjustment. Calculate excess return relative to the chosen benchmark and divide by realized volatility measured over a documented window. Add a minimum observation requirement and turnover constraints so unstable calculations don't dominate the ranking.
-
Require participation confirmation. Inspect breadth and supporting volume before accepting a new leader. Keep assets with questionable pricing or execution conditions out of actionable interpretations, even if they remain visible for monitoring.
-
Label the return convention. State whether you're measuring price change alone or including distributions and other return components. Don't combine differently defined series under the same color legend.
The finished dashboard should contain a row per bucket, the selected horizons, both weighting methods, breadth, and a data-quality flag. Put the benchmark, timestamp, classification version, eligibility rules, and return convention in a visible footer.
A dashboard is reproducible only if another analyst can rebuild the same result from its definitions.
Save historical membership as well as prices. Otherwise, rebuilding an old map with today's surviving constituents answers a different question from the one traders faced at the time.
Suppose a hypothetical DeFi tile shows a strong cap-weighted gain, a much smaller equal-weighted gain, and a positive daily color. Its monthly excess return remains negative. The immediate temptation is to call DeFi the next rotation.
Start with attribution. The difference between the weighting methods tells you to inspect the largest constituents, but it doesn't yet identify which asset drove the result. Calculate each member's weighted contribution rather than guessing from its tile size.
- Weighting check: The largest token supplied most of the positive contribution. Treat the headline as concentrated until participation supports a broader interpretation.
- Breadth check: In this scenario, most constituents didn't advance. The candidate fails the broad-leadership test.
- Horizon check: The positive daily move hasn't overcome the negative monthly benchmark-relative result. Persistence remains unconfirmed.
- Classification check: The dominant token has substantial exposure outside the bucket's stated DeFi definition. Review whether its inclusion answers the intended research question.
The verdict is a concentrated reaction, not confirmed sector rotation. That doesn't mean the dominant token can't keep rising. It means the sector tile doesn't establish the broader thesis being proposed.
For a real reference point on return conventions, the SIA Telecommunications Services Equal Weight Index was the strongest sector in SIA's 2024 year-to-date market-sector report, rising 41.80%, according to SIACharts. That finding identifies an equal-weight leader within that report; it doesn't establish the ranking of a corresponding cap-weighted series.
Confirm the weighting before comparing tiles. Matching colors don't make differently constructed baskets comparable.
The useful conclusion isn't that equal weighting is always better. It's that each weighting answers a different question, and your trade thesis needs the right answer.
Treat rotation as a research verdict with explicit conditions, not as a synonym for green. A candidate passes only when persistence, benchmark-relative performance, participation, and classification agree.
Use the following decision gate before adding a sector thesis to your trading plan.
| Test |
Pass condition |
If it fails |
| Persistence |
Leadership survives across distinct horizons |
Keep it as an unconfirmed reaction |
| Relative strength |
The sector outperforms the chosen benchmark |
Don't confuse a market rally with sector leadership |
| Participation |
Weightings agree reasonably and members broadly participate |
Investigate concentrated leadership |
| Classification |
Constituents match the documented bucket definition |
Rebuild or relabel the basket |
Even a passing sector doesn't determine entry price or position size. Set the risk allocation in advance, define the exit price, and write the thesis-invalidation condition before entering. A classification change, deteriorating participation, or loss of relative strength may invalidate the thesis even before a price stop is reached.
A disciplined crypto sector rotation process should also distinguish sector evidence from background context.
For supporting context, our market intelligence dashboards cover funding, liquidations, order flow, and on-chain metrics. Pro includes funding, liquidations, volume, and open interest for the top 20 assets, plus a divergence and SFP heatmap; prices, funding rates, open interest, and volume update every 5 minutes through aggregated exchange feeds. Those inputs support investigation, but they don't replace constituent-level checks.
Run your map through the decision gate for a week before relying on its verdicts. Keep a log with date, bucket, horizons passed, breadth result, classification status, and outcome, and define the outcome review point before recording results.
Judge the process by whether its recorded conclusions held under those definitions, not by how convincing the original colors looked.
Thrive combines a cryptocurrency trading journal with market intelligence, so you can review sector-based trades alongside the conditions surrounding your decisions. Visit Thrive to record your rotation thesis, track execution and psychology, and compare the outcome with your original heat-map verdict.