A high win rate can still sit on top of a losing account. The reason is simple: winning often and winning enough are two different things. A trader who takes small wins and occasional large losses can look skilled on a scoreboard, then bleed money where it matters, in the account balance.
A 2025 review of retail swing trading results reported a sample of nearly 30,000 active accounts with a 63.8% win rate and a profit-to-loss ratio of only 0.5, because average winners of $37.29 met average losers of $74.03. That is the core problem in one line. The accounts won most of the time, yet each losing trade was about twice the size of each winning trade.
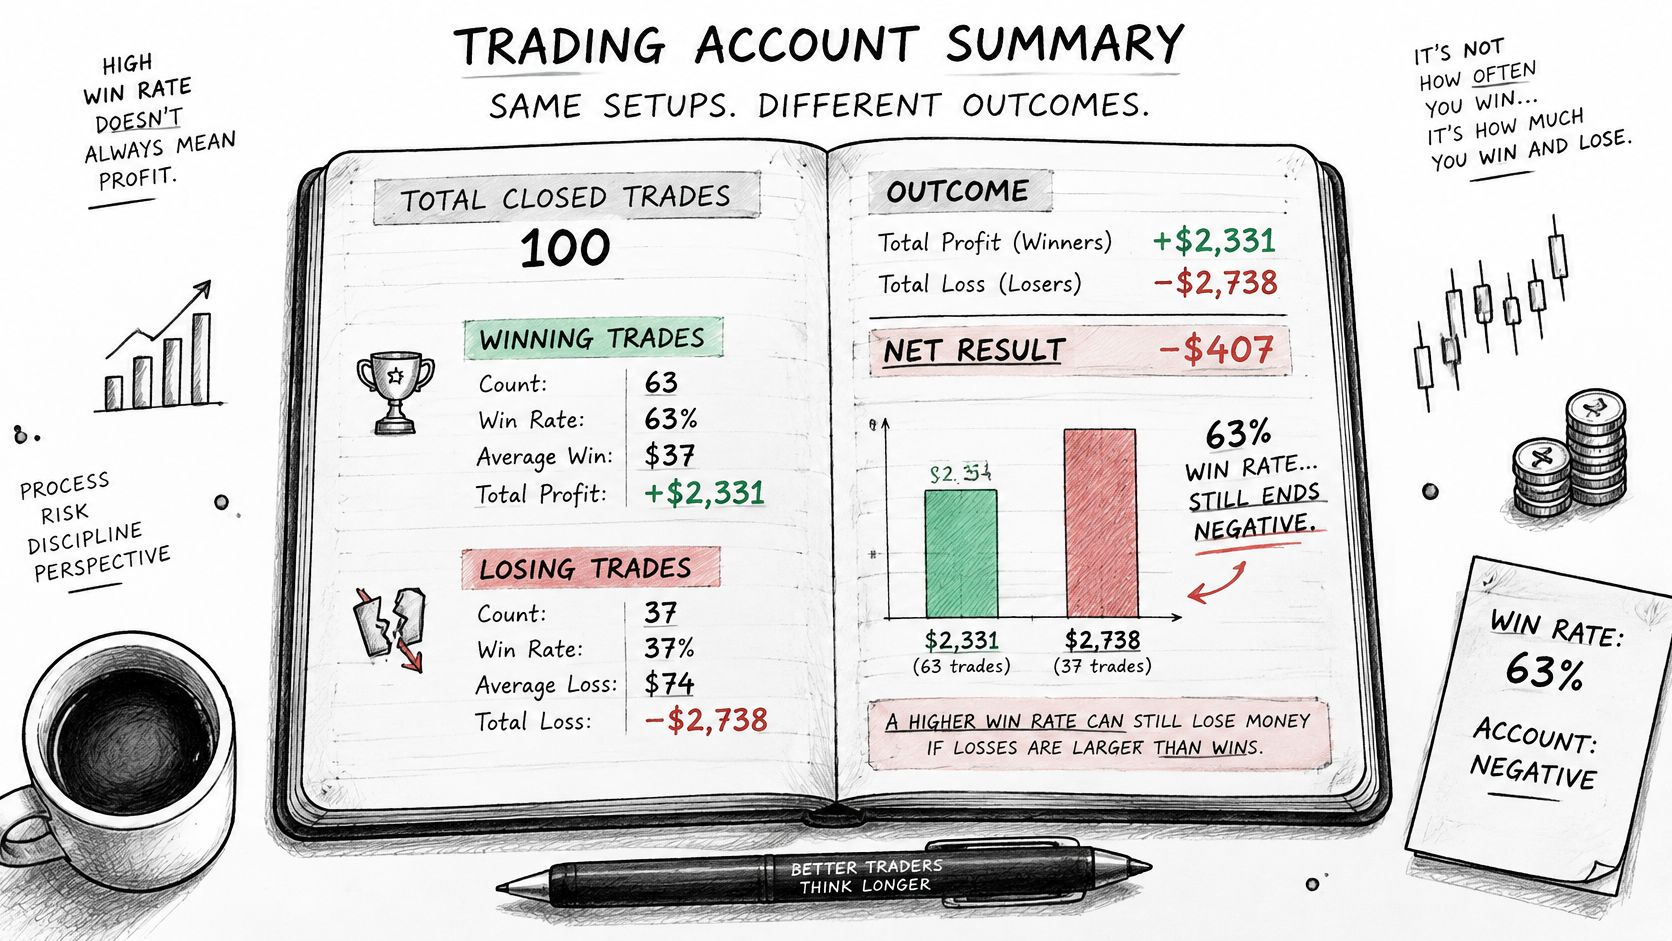
Use a hypothetical account to slow the arithmetic down. It closes 100 trades: 63 winners averaging $37, for +$2,331, and 37 losers averaging $74, for -$2,738. The account nets a loss of $407 while winning nearly two trades out of three.
Two ratios describe that same account, and they answer different questions. The count version is winners divided by losers: 63 ÷ 37 = 1.70. That number says the trader closed about 1.7 winning trades for every losing trade. The payoff version is average win divided by average loss: $37 ÷ $74 = 0.50. That number says the average winner is half the size of the average loser.
The win rate is a third number: profitable trades divided by all trades. In this example, 63 ÷ 100 = 63%. A clean label matters here, because traders often quote the count ratio while implying the payoff ratio, then assume the result describes profitability. It does not. The count ratio describes frequency. The payoff ratio describes size. The win rate describes how often trades finish green.
Think of the account like a bucket with a wide inlet and a wider drain. The inlet opens often, which feels encouraging. The drain opens less often, but it removes more water each time. Unless the inlet is widened or the drain is narrowed, the bucket keeps losing level.
The practical lesson is blunt: a better-looking ratio can come from better trade selection, tighter losses, or more small wins. Only one of those guarantees a stronger average outcome. Raising the win rate is often worth less than shrinking the average loss, because a handful of oversized losers can erase a long run of small wins.
For education only, not financial or investment advice. Crypto and margin trading can cause substantial losses; examples do not predict future results.
A journal export shows 50 closed trades from one quarter: 20 winners averaging +1.5R and 30 losers averaging -1R. Nothing in that list looks extreme, yet it will produce three different numbers, and only two of them are the win loss ratio. Work through it the way an accountant reconciles a ledger: build the list first, do the divisions last.
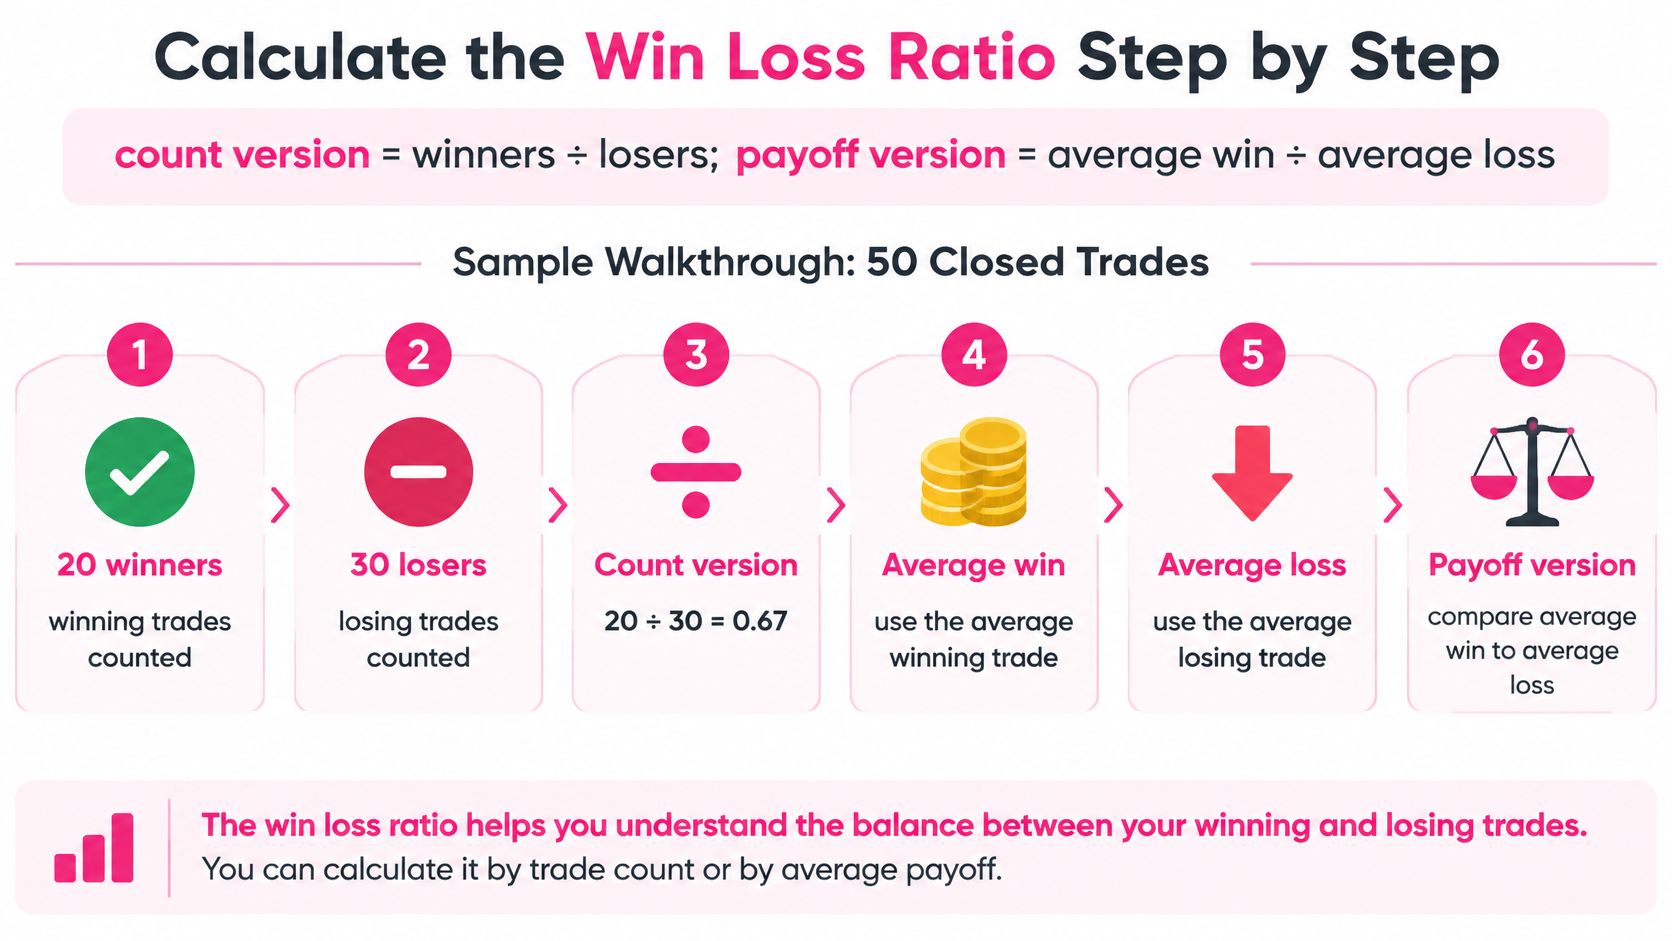
- Export one fixed period of closed trades. Use the same window for every trade, and record each partial close as its own line, because one position booked as three results inflates both the winner count and the loser count.
Positions held in Solana wallets sit outside exchange exports entirely, so a Solana Wallet PnL view gives the same trade-level record for onchain activity that a CSV export gives for perpetuals.
- Drop open positions and list breakeven trades separately. Open trades have no result yet and breakeven trades belong in neither count, so removing both keeps the averages honest.
- Convert every result to R. R is the planned loss at the stop set before entry, so a $200 risk and a $2,000 risk land on one scale and position size stops distorting the comparison.
- Average the winners, then average the losers. Add the winning R values and divide by the number of winners, then repeat for losers, because the two averages answer different questions.
- Calculate the count version. Winners divided by losers: 20 ÷ 30 = 0.67. Below 1 means more losing trades than winning ones.
- Calculate the payoff version. Average win divided by average loss: 1.5R ÷ 1.0R = 1.50. Each average winner is one and a half times the average loser.
- Calculate the win rate. 20 ÷ 50 = 40%. Any spreadsheet cell runs the same division.
Now total the list end to end: 20 × 1.5R gives +30R, and 30 × 1.0R gives -30R, a flat 0R before fees and funding. Read that again. The payoff ratio sits at 1.50, which looks comfortable, and the account still earns nothing because the losers arrive more often than the winners. Once fees and funding enter the arithmetic, that breakeven line slides into the red.
Five hypothetical strategies, 100 closed trades each and all results in R, show where intuition fails. Every figure below is illustrative and excludes fees, funding and slippage.
| Hypothetical strategy |
Win rate |
Avg win / avg loss |
Expectancy per trade |
| A: 2R winners, 1R losers |
40% |
2.0R / 1.0R |
+0.20R |
| B: 0.5R winners, 1R losers |
60% |
0.5R / 1.0R |
-0.10R |
| C: 0.5R winners, 1.5R losers |
70% |
0.5R / 1.5R |
-0.10R |
| D: 3R winners, 1R losers |
30% |
3.0R / 1.0R |
+0.20R |
| E: 1R winners, 1R losers |
50% |
1.0R / 1.0R |
0.00R |
Strategy B wins six trades in ten and still bleeds 0.10R per trade. Strategy C wins seven in ten and loses the same amount. Meanwhile A and D reach an identical +0.20R from opposite profiles, one patient and one selective.
The calculation behind each row is the one CME Group sets out in The Mathematics of Trading Success: (frequency of winning trades × average win) minus (frequency of losing trades × average loss). CME's own worked example has a trader winning 40% of trades, averaging 3 risk units on winners and 1 on losers, for 0.60 risk units per trade.
Apply it to the table. Strategy A gives (0.40 × 2R) - (0.60 × 1R) = +0.20R. Strategy B gives (0.60 × 0.5R) - (0.40 × 1R) = -0.10R. Strategy E gives (0.50 × 1R) - (0.50 × 1R) = 0.00R, a coin flip that pays nothing for the effort.
That's the whole argument in three lines. Frequency alone can't reveal whether an edge exists, because the payoff has to be read beside it. Recording R-multiples rather than dollars is what makes the rows comparable, since a 2R win on a $200 risk and a 2R win on a $2,000 risk are the same decision quality and very different cash.
Whether a given ratio is good depends entirely on the win rate sitting beside it. The break-even payoff is the loss rate divided by the win rate, and a strategy has to beat that threshold before costs to be worth trading.
| Win rate |
Reading |
| 30% |
Winners must be about 2.33 times the size of losers |
| 40% |
Winners must be 1.5 times the size of losers |
| 50% |
Winners and losers must be equal size |
| 60% |
Winners can be about two-thirds the size of losers |
| 70% |
Winners can be under half the size of losers |
Three quick checks. At 40%, the break-even payoff is 1.50, so a 1.50 profile nets exactly 0.00R. At the same 40%, a 2.00 payoff gives (0.40 × 2.0R) - (0.60 × 1.0R) = +0.20R, clear of the line. At 70%, the threshold drops to 0.43, so a 0.50 payoff gives (0.70 × 0.5R) - (0.30 × 1.0R) = +0.05R, a margin thin enough that a small cost per trade can wipe it out.
Practical rule: a count ratio above 1 proves nothing on its own. The payoff has to clear the break-even line for the win rate you actually have.
Costs push that line higher, and the difference between a 0.05R edge and a 0.00R edge is usually decided by execution rather than by the entry signal. For a deeper treatment of how the two sides of a trade balance, this guide to risk reward ratios in crypto trading works through the sizing side.
Fees and funding reduce the expectancy a ratio implies, so every ratio deserves two readings: one on price alone, one after costs. The gross-to-net picture for 20 hypothetical trades: 8 winners averaging $150 and 12 losers averaging $75.
| Line item |
Total |
| Gross price PnL on 20 hypothetical trades |
+$300 |
| Assumed trading fees at $6 per trade |
-$120 |
| Assumed funding, three intervals at 0.01% on $10,000 notional, $3 per trade |
-$60 |
| Net result after costs |
+$120, or +$6 per trade |
| Net result in the stress case, funding at 0.05% per interval, $15 per trade |
-$120, or -$6 per trade |
The gross numbers look comfortable: a count ratio of 8 ÷ 12 = 0.67 and a payoff of $150 ÷ $75 = 2.00. Fees take $120 of the $300 and funding takes another $60, leaving $120, or 40% of the original edge. Push funding to 0.05% per interval and the same trades finish at -$120. Nothing about the entries changed. The cost line alone flipped the result from positive to negative expectancy, which is why a healthy-looking ratio can still describe a losing strategy.
Funding is a direct transfer between long and short traders rather than an exchange trading fee: when the perpetual trades above its spot index and the rate is positive, longs pay shorts, and when the rate is negative, shorts pay longs. Per Binance's futures funding explainer, the default interval is every 8 hours at 00:00, 08:00 and 16:00 UTC, and the charge equals nominal position value multiplied by the rate.
Run the arithmetic on a $10,000 notional long held through three positive periods at 0.01%: it pays $1 per interval, $3 in total, before any trading fee. At 0.05% per interval the same position pays $5 each time, $15 across three periods. Funding multiplies the notional you control, so the charge scales with position size rather than with the margin you posted.
Whatever journal you use, keep fees and funding as separate fields instead of folding them into one net figure, so a review can measure expectancy before and after each cost. Thrive's journal accepts CSV imports and read-only account synchronization, with exports in CSV or JSON, which makes that split checkable later; confirm the export carries fee and funding columns before trusting any net number. For slippage, record the expected fill next to the actual fill, since no single slippage figure holds across venues and volatility conditions. The fee side deserves its own pass, and this breakdown of crypto trading fees covers maker, taker and withdrawal costs.
Take a hypothetical journal where the average winner is three times the size of the average loser. If only one trade in five wins, expectancy still runs negative: 0.20 x 3R minus 0.80 x 1R comes to -0.20R per trade. A favorable-looking ratio and a losing account can sit in the same row. The number only means something once average win, average loss, fees, funding and position exposure enter the same view.
Six traps account for most of the misleading ratios in a real journal. Each one comes with a test you can run in a few minutes.
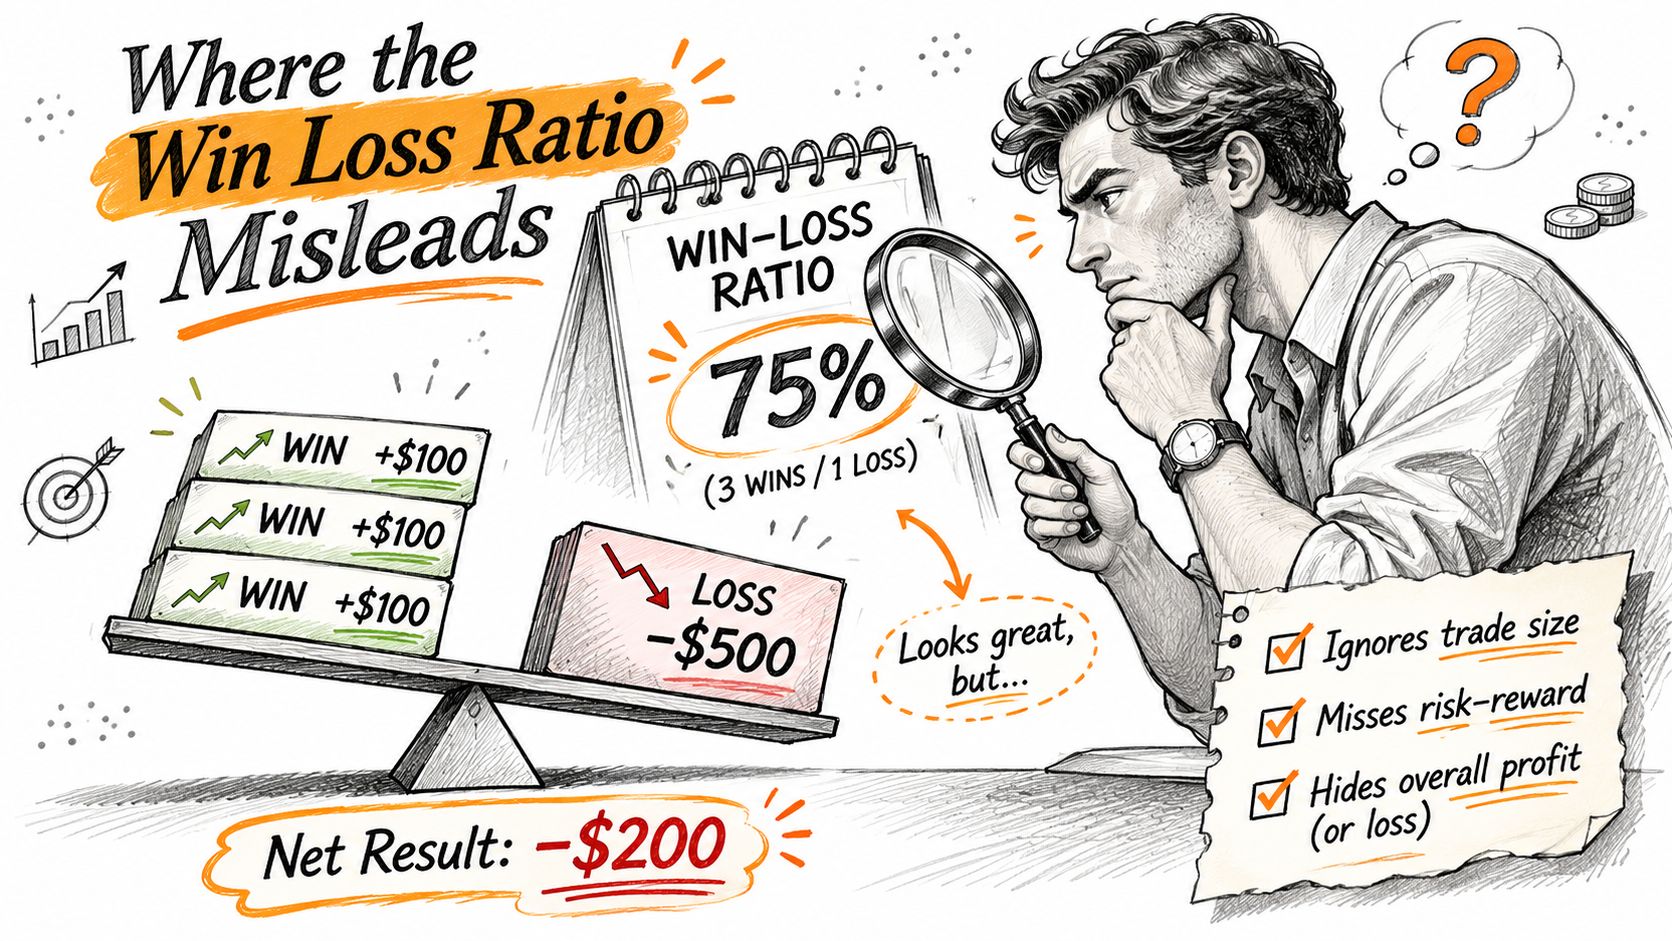
- Small samples. Twenty trades can be dominated by two outliers. Delete the largest winner and the largest loser, then recalculate; if the ratio flips, you're measuring luck.
- Selection bias. Traders count winners and drop the position they cut early. Reconcile the list line by line against the exchange statement, because a ratio built on a partial list describes a strategy that never existed.
- Mixed holding periods. Scalps and multi-day holds averaged together describe neither. Split the sample by holding period before comparing, since a scalping book and a swing book produce different ratios by design.
- Liquidations. A forced close books the outcome at the liquidation price, which can overstate the average loss and bury the risk breach that preceded it, so flag liquidated trades as their own category.
- Exposure. It changes the dollars, never the ratio. A $1,000 account controlling $5,000 of notional through 5x exposure takes a $500 loss on a 10% adverse move, half of equity before fees and funding, as the CFTC's perpetual futures note_0.pdf) sets out.
- Market regime. A ratio collected in calm conditions can fail in a sharp move. A crypto market report on derivatives exposure and ETF outflows described $1.53 billion in liquidations over 24 hours, 84% of them in long positions, while Bitcoin perpetual open interest rose 4.5% during part of the selloff.
The multiplier is not a property of the perpetual contract itself. Each platform sets permitted exposure through its own risk-management framework, and liquidation thresholds depend on venue rules, maintenance margin, mark-price methodology and fees, so treat any simple percentage as an approximation rather than a forecast.
When a ratio drops, check position size and the margin multiplier before deciding the setup stopped working. The signal often held; the sizing is what failed.
Deciding whether a sample is large enough to trust is its own discipline, covered in this guide to sample size in crypto trading.
The ratio answers one question: how big are winners relative to losers. Three companions answer the rest, and they all come from the same closed trade list, so they can be checked against each other.
| Metric |
Formula |
What it adds to the ratio |
| Profit factor |
Gross profit ÷ gross loss |
Total winnings per unit of total losses |
| Maximum drawdown |
Largest peak-to-trough fall in equity |
The losing streak that averages hide |
| Average R per trade |
Net R ÷ number of closed trades |
Comparison across periods with different position sizes |
Read them in order. Expectancy first, because it tells you whether the profile pays at all; profit factor next, since it weighs the whole gross profit against the whole gross loss; maximum drawdown after that, because it shows what the run felt like while it was happening.
Take a hypothetical strategy with a 40% win rate, 2R winners and 1R losers. Across 100 trades, 40 winners produce 80R of gross profit and 60 losers produce 60R of gross loss, for a count version of 0.67 and a profit factor of 1.33. Now add a hypothetical equity curve with a 25% drawdown along the way. Neither the ratio nor the expectancy showed that dip, and the dip is what decides whether a trader keeps following the process.
For the wider metric set, including the ones that don't belong in this list, this overview of trading metrics beyond win rate is the next read. For the per-trade figure specifically, expectancy in crypto trading covers how to calculate it and where it breaks.
A month of synced trades might produce 44 winners and 56 losers, a count version of 0.79 that still says nothing about whether the account grew. Getting from that raw list to a reading you can trust takes the same three calculations, each computed in R after fees, funding and the sizing applied to the position:
- Count version: winners ÷ losers, recalculated per setup rather than per account.
- Payoff version: average win ÷ average loss, checked against the break-even line for your win rate.
- Expectancy and drawdown: read together, because the second one decides whether you can stay with the first.
Rebuilding those figures by hand each week is where the habit usually breaks: partial closes, export formats and fee columns are easy to mishandle, and a single mislabeled fill skews the payoff version. A synced journal takes that arithmetic out of the routine. Thrive Pro combines manual entries, CSV imports and read-only account auto-sync, which cannot place orders or move funds, into a trade journal with emotion and psychology tags per trade, and its performance reporting covers win rate, profit factor, an equity curve and R-multiples. It comes with a 7-day free trial, then $99 per month, and canceling before the trial ends means paying nothing. Pro+ costs $199 per month with no trial, and annual billing gives 2 months free.
The logging habits that make either record usable are covered in this guide to keeping a trading journal.
Whatever holds your records, the weekly test stays the same: pull the closed trade list, confirm fees and funding sit inside each result rather than beside it, and read the count version next to the payoff version and the expectancy they produce. A ratio that only looks healthy with its costs left out is exactly the misread the ratio invites.

