Take that Bitcoin morning and slow it down. Price has failed near $60,000 three times, so stops sit just above it: short protective stops, plus breakout buy orders from traders waiting for confirmation. The fourth push trades through all of them, fills the queued orders, and then closes back below the level. Nothing about the asset changed in those four hours except the queue of orders that got consumed.
That's the event traders call a liquidity sweep: price trades through a zone where stop orders, breakout orders or forced exits are stacked, consumes that resting liquidity, and then either continues or snaps back. The analogy that holds up is a crowded exit. When the doors open, people pour through in a rush because a hundred people were queued at the same spot, not because the room itself changed. The queue caused the stampede.
The mechanism is older than the chart vocabulary. A 2002 Federal Reserve Bank of New York staff report by Carol Osler examined more than two years of minute-by-minute quotes in dollar-mark, dollar-yen and dollar-pound markets. Osler defined stop-loss orders as instructions to trade at the market once a specified price is reached, then showed that clustered stop orders generate positive-feedback trading: the first move activates orders in the same direction, those fills extend the move, and the extension trips more stops. The report calls the result a "price cascade."
Crypto traders now call that sequence a sweep. The label changed. The plumbing didn't.
What the evidence does not say. Stop activation can produce continuation, an overshoot or a clean reversal. All three are documented outcomes of the same mechanism, so a breach on its own tells you very little about what comes next. Treat a sweep as an event to timestamp, record and test, never as proof that someone deliberately hunted your position.
For education only, not financial or investment advice. Crypto and leveraged trading can cause substantial losses; examples do not predict future results.
Stop orders gather at the same handful of prices on every active chart. Breakout buyers park entry stops above a high, and shorts park protective stops in the same place, so a prior high holds a stack of buy orders waiting for a trigger. Below a low, the pattern mirrors: long stops and breakout sells.
| Level type |
Where orders usually sit |
What a sweep looks like |
Field to log |
| Prior swing high or low |
Just beyond the last confirmed pivot |
Wick through the pivot, then a close back inside |
Distance beyond the pivot in percent or ticks |
| Equal highs or equal lows |
Above or below two or more matching touches |
Quick spike through the cluster |
Number of touches at the level |
| Previous day high or low |
Beyond the prior session extreme |
Trades through, then reclaims the level |
Session and time of the break |
| Range boundary |
Just outside a consolidation box |
Breakout that fails within a few candles |
Candles spent outside the range |
| Estimated liquidation cluster |
Near levels where margined positions would be closed |
Sharp wick with a liquidation spike |
Liquidation volume at the wick |
Treat the table as a checklist you work through before each session. A prior swing high matters because it is the most visible pivot on the chart. Equal highs matter more, because every retest adds another layer of orders, which is why a clean double top so often gets pierced. The previous day's high and low carry the positions of everyone who traded that session, and range boundaries act as a two-sided trap: sell stops below the floor, buy stops above the ceiling.
The fifth row is the one crypto adds to older frameworks. On perpetual futures, forced exits gather around prices where margined positions would be closed, and those prices can be estimated from open interest instead of guessed from a candle. That cluster differs from an ordinary swing level in a way worth logging: the orders sitting there trigger whether or not the traders behind them want them to.
For a deeper look at how these pools form and how they behave on retests, this explainer on liquidity zones and how they build on a chart walks through the mapping process.
Depth changes with the clock. A 2023 systematic review of cryptocurrency market microstructure published by Springer reports that liquidity generally falls after negative news announcements and rises after positive ones, and finds Bitcoin liquidity is highest around the opening times of major global exchanges and lower during the early morning. The review also links higher liquidity with lower volatility.
The practical consequence is blunt. A thin book lets modest aggressive flow push price through several nearby levels, while a deeper market absorbs the same flow with less slippage. An identical-looking sweep at 04:00 and at the London open can be two different events with different follow-through rates, so the time of day belongs in your log next to the level type.
Do this before your next session: mark five levels, label each one by type, and write down the time you marked it. Over the next ten events, log each breach with its close, volume, spread, open interest and outcome. Then compare which level type produced the cleanest reaction, and which session window produced the most failures.
The workflow below turns a chart impression into a record you can compare against other records. Each step exists because of a specific failure: marking levels after the fact, guessing at the excursion, or mistaking an accepted breakout for a rejection.
The four core checks compress into the sequence below, and the fuller workflow follows it.
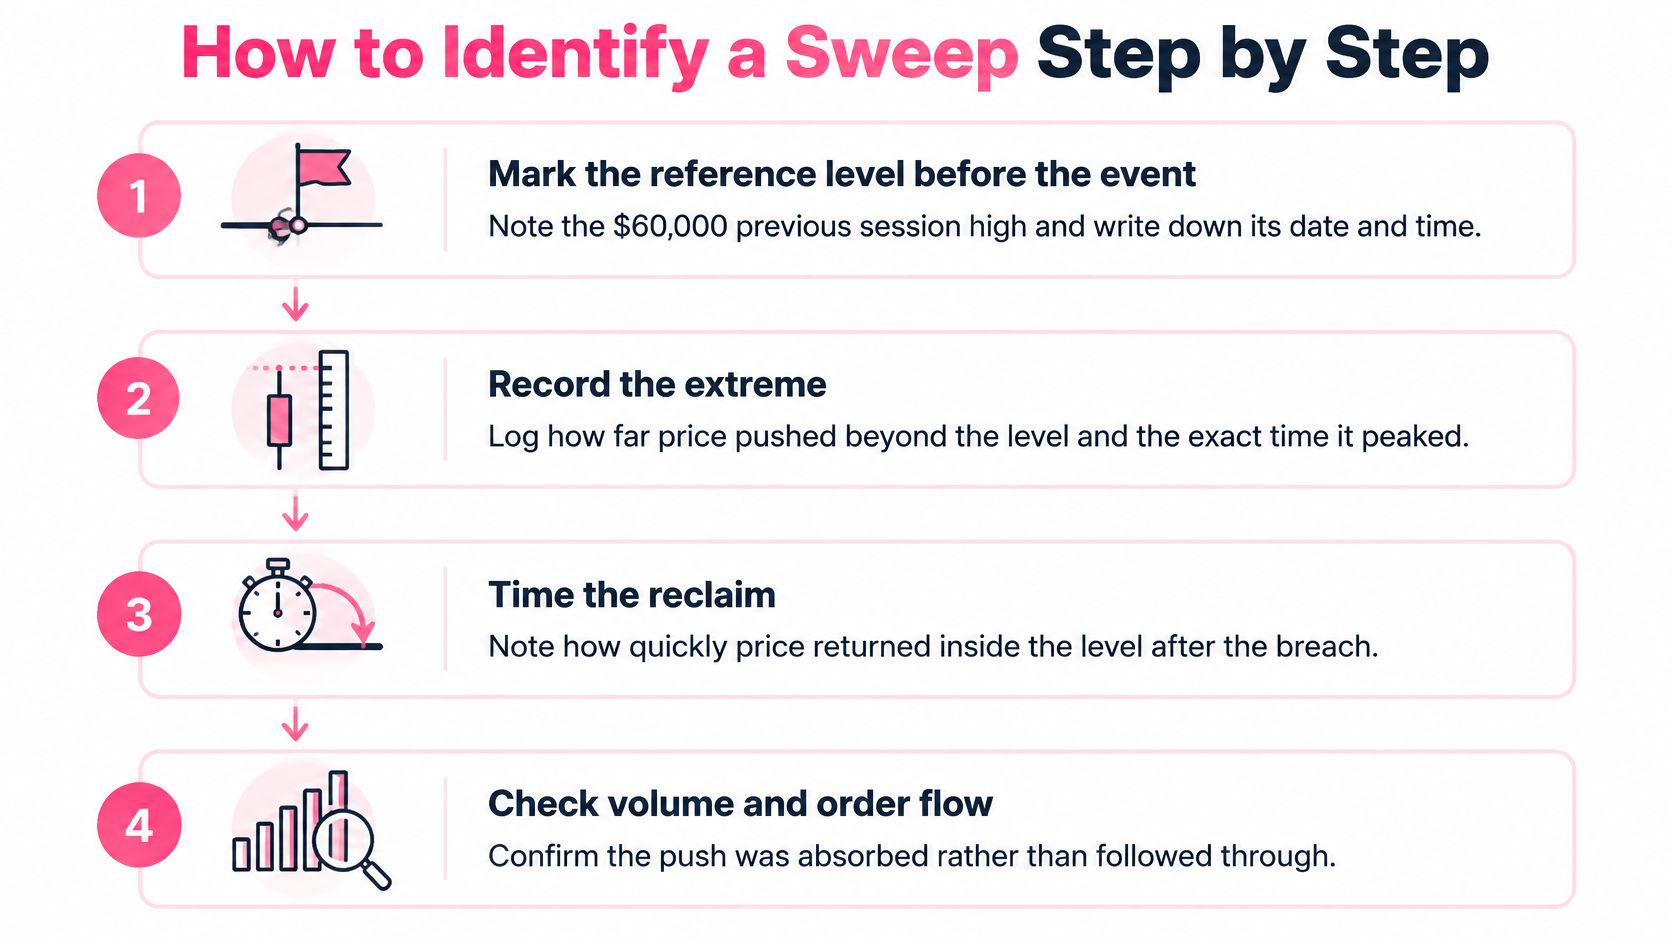
- Mark the reference level before the event. Write the price, the date and the time, and name the type: prior swing high, equal high, daily high or equal low. A level drawn after price has already moved lets you pick whichever line fits the story you want to tell.
- Record the extreme and the excursion. Log the wick's high, the distance beyond the level in points and in percent, and the candle where it printed. A push to $60,120 past a $60,000 level is $120, or 0.2 percent. That overshoot size is a regime variable, not a fixed property of sweeps.
- Estimate resting depth around the level. Measure depth within fixed basis-point bands around mid-price, then compare the aggressive volume needed to trade through the zone with the depth that was resting there. Sparse books let a small market order move price several ticks, so an excursion during depth deterioration may be mechanical impact. Strong depth plus price acceptance beyond the level gives continuation more support.
- Check the close. A sweep usually closes back inside the old range within one to three candles. A close that holds beyond the level points toward a breakout, and labeling it a sweep early is the most expensive habit in this framework.
- Read volume and spread together. A volume spike that fades inside two candles looks nothing like sustained volume with an expanding range. Spread tells you what execution cost while the event was printing.
- Check open interest and liquidations. Falling open interest alongside a liquidation spike points to forced exits being cleared. Rising open interest while price holds beyond the level points to fresh positioning.
- Count the recovery. Measure how many candles price needed to reclaim the level, or record that it never did. Recovery speed is the difference between absorption and acceptance.
- Save the event with its label and its outcome. Without both fields, you have an anecdote, not a sample.
The order-book framing matters. As a review of liquidity and informed trading in electronic markets sets out, passive limit orders supply liquidity while market orders and aggressively priced limit orders demand it. New information arrives through those market orders, and traders act on incomplete information while liquidity conditions shape execution quality and cost. A record that omits spread and depth is missing half the event.
That's also why order flow, not candle shape, does the confirming. Trading order flow analysis in crypto markets covers how to read absorption at the level rather than waiting for a wick to look convincing.
Practical rule: a close-back-inside requirement is a hypothesis about your market and your timeframe, not a law of price behavior. Test it before you size a position on it.
No universal confirmation threshold exists. Whether one candle or three counts as confirmation depends on the asset, the session and the volatility regime, and the only way to know is to label events on your own charts and count.
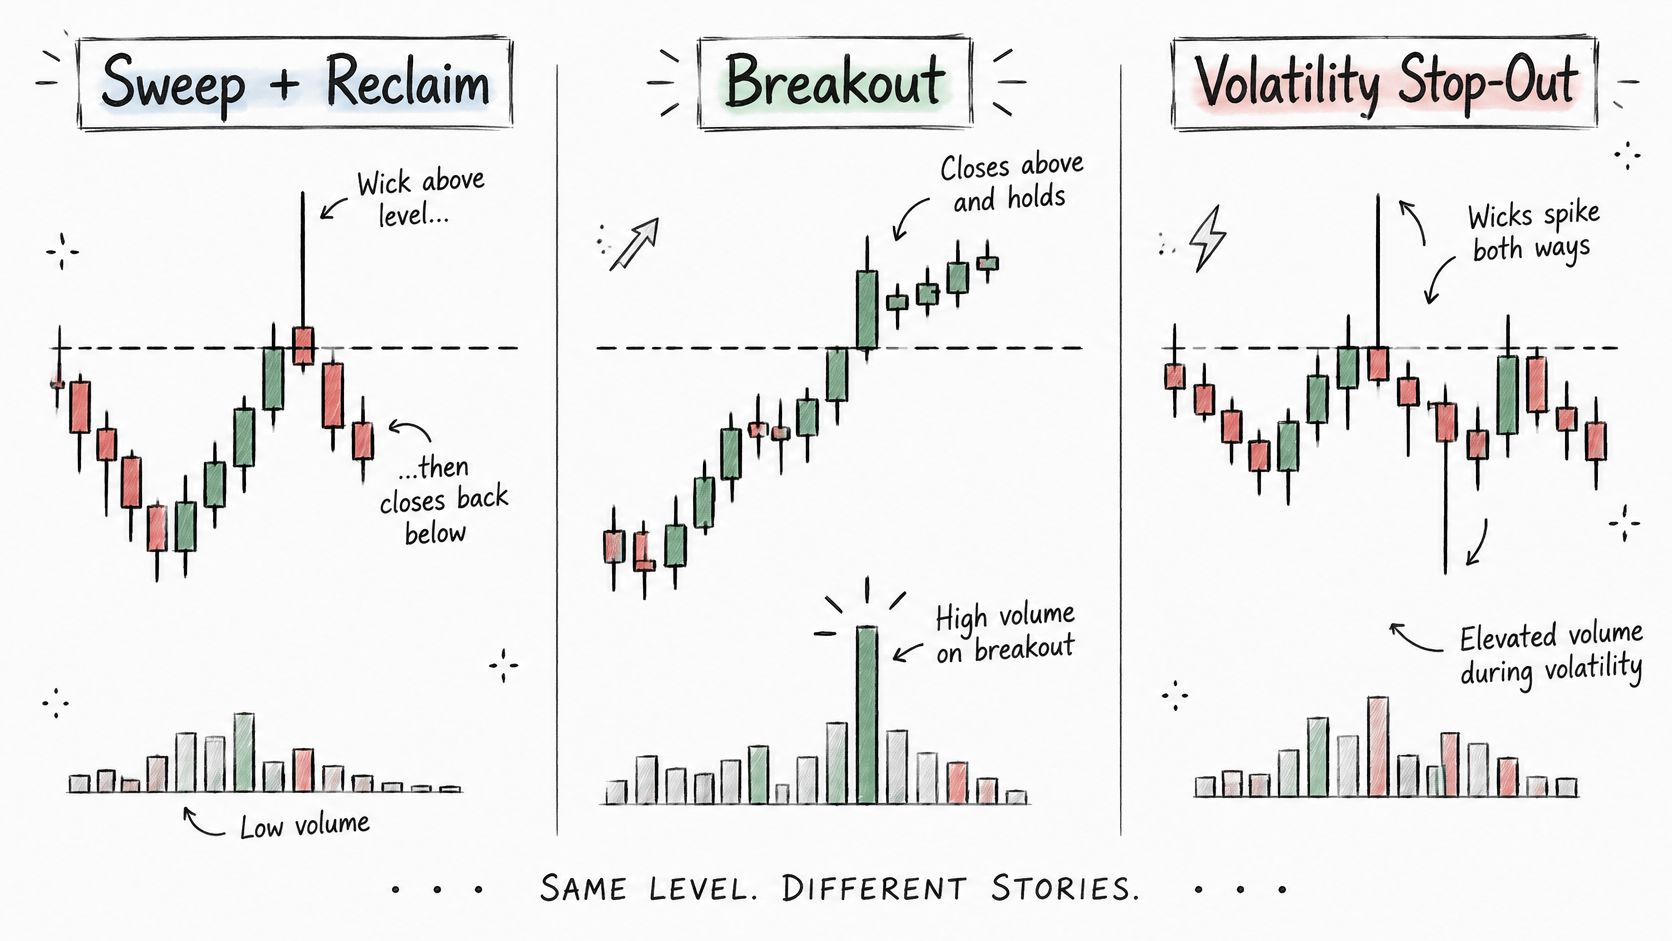
Three outcomes all breach a level, and they look nearly identical for the first few candles. The table separates them based on the evidence that differs.
| Outcome |
Price after the breach |
Volume and order flow |
Open interest |
Usual read |
| Sweep with reclaim |
Closes back inside the level within one to three candles |
Spike that fades quickly |
Falls as positions close |
Stops cleared, possible absorption |
| Continuation breakout |
Holds and closes beyond the level |
Sustained and expanding |
Rises as new positions open |
Accepted move, not a sweep |
| Volatility stop-out |
Spikes, then drifts without returning |
Broad volume across the session |
Drops sharply as forced exits clear |
Forced flow, often news or macro driven |
Plotted side by side, the three paths separate on exactly those fields.
- A close beyond the level on two or more candles. Acceptance is the opposite of a reclaim, so stop relabeling it.
- Volume expanding in the breakout direction. Real breakouts recruit participants; sweeps exhaust them.
- Open interest rising with the move. New positions are being built in the direction of travel, not unwound.
If any one of those holds, treat the event as a breakout or a news-driven move until the data says otherwise. Retrospective labeling does the most damage here: a trader who counts every wick beyond a prior high as a sweep can make any chart look like a strategy with a high hit rate.
The distinction is hard, and the honest state of the evidence reflects that. A review of liquidity sweep and stop-hunt mechanics notes that large orders can consume multiple price levels and trigger clustered stops without any manipulation, and that research has not established systematic, exploitable stop hunting across major markets once order flow and volatility regimes are controlled for. Osler's 2002 findings and the 2023 microstructure review both fit that reading: the flow is real, the intent is unproven.
Plenty of venues and assets don't publish usable open-interest or liquidation data. Classify with close, volume and spread alone, then flag the event as lower confidence in your journal. A degraded label recorded accurately beats a confident label built on missing inputs.
Before applying this to a live chart, go back through ten past breaches and classify each one as sweep, breakout or stop-out. If you can't sort them with the table, the criteria need tightening before your capital is involved. The mechanics behind false breakouts are covered in more depth in this guide to breakout trading and fakeouts.
In perpetual futures, a sweep can be a forced margin cascade rather than a discretionary reversal. Borrowed exposure converts a small price move into a margin event, and the resulting market orders come from the venue's risk engine, not from a trader's decision.
| Collateral |
Multiplier |
Notional position |
Loss on 5% adverse move |
Share of collateral lost |
| $1,000 |
5x |
$5,000 |
$250 |
25% |
| $1,000 |
10x |
$10,000 |
$500 |
50% |
| $1,000 |
20x |
$20,000 |
$1,000 |
100% |
Every row is illustrative and excludes fees, funding and maintenance rules. The 20x row shows the full posted collateral lost on a 5 percent move before any buffer is applied.
Take the 10x row. The position notional is $10,000 against $1,000 of collateral, so a 5 percent adverse move costs roughly $500 and leaves about $500 of equity before maintenance requirements, fees and funding are deducted. Run that calculation before entry: loss equals notional multiplied by the adverse percentage, and remaining equity gets compared with the exchange's published maintenance requirement.
A public comment filed with the Securities and Exchange Commission on crypto margin products makes the same point about inference: the exact liquidation price cannot be derived from collateral and multiplier alone, because venues use different maintenance-margin schedules, mark prices, fee deductions and risk tiers. Two exchanges can liquidate the same notional position at different prices.
Check whether margin is isolated or cross, since that decides whether one position can drag the rest of the account. Check whether the venue can allocate liquidation losses to winning positions when available resources are exhausted. Then model the sequence: discretionary stops trigger first, liquidations follow once margin thresholds are hit, and the extra forced flow can create a wick that later reverses. Treat this sequence as a testable hypothesis until the data supports it.
A sweep that clears resting stops and a sweep that marks a broader margin unwind produce different follow-through, so they belong in different buckets in your records.
The decision model after a sweep runs on five inputs: where price sits relative to the level, the direction of open interest, funding, liquidation imbalance, and recovery speed. Log each breach with its close, volume, spread, open interest and outcome, then label it only after those fields are complete. That yields three choices: fade the move, wait for confirmation, or stand aside because positioning is still unwinding. Keeping a funding rates and open interest playbook beside the chart makes the second and third choices far easier to apply in the moment.
One candidate event, worked end to end. The numbers are illustrative, drawn from the kind of entry the earlier steps produce, not from a live position.
The reference level is the $60,000 previous session high on a Bitcoin perpetual, marked at 08:00 UTC before the session. Price wicks to $60,120. The candle closes back below the level, and two candles later the close prints $59,850 on a volume spike that fades. The trader waits for that close, then shorts the reclaim with $10,000 notional and $2,000 collateral at 5x. The venue's margin rules govern any real position, so treat the sizing as a template rather than a recommendation.
The stop sits at $60,329, far enough above the wick that a second probe of the level does not tag it.
| Field |
Hypothetical value |
| Reference level |
$60,000 previous session high |
| Extreme and excursion |
$60,120 high, $120 or 0.2 percent beyond the level |
| Confirming close |
$59,850 close two candles after the wick |
| Notional and collateral |
$10,000 notional, $2,000 collateral at 5x |
| Stop |
$60,329, 0.8 percent above entry and above the wick, about $80 gross risk before costs |
| Fees, funding and max adverse excursion |
Record from the venue statement |
| Classification |
Candidate failed upside sweep, rule-based label only |
| Outcome |
Record after exit |
The post-trade test separates the price event from the execution result. A published methodology note on post-trade analysis frames it as four steps: define the level before the trade, record the extreme and percentage excursion plus whether price closed back below, document notional, collateral, stop distance, fees, funding and maximum adverse excursion, then compare the result against similar trades grouped by asset, timeframe, direction and confirmation rule.
That separation matters because a correct sweep label can still produce a losing trade. The event was classified properly and the entry still went against you. Only a record that holds both fields tells you which one failed.
The same fields, close, volume, spread and outcome, are what you would log for every breach, so this entry can sit beside the next fifty for comparison. Thrive Pro is built around that record: a trading journal with performance analytics and read-only exchange sync, plus market data on the top 20 assets covering funding, liquidations, volume and open interest. It runs 7 days free, then $99 per month, and read-only access means it cannot place orders or move funds.
Then test the label, not just the trade. Once the records are sorted into those groups, keep a rule only where the result holds inside each one. A rule that works in one session and fails in three others is a session filter you haven't named yet. The mechanics of building that log are covered in this guide on how to keep a trading journal.
- Entering on the wick before a close confirms anything. Fix: apply the close rule from step four and record the close time, so the entry decision is documented rather than remembered.
- Backtesting on fills you could never have gotten. Order-book research finds that when liquidity is sparse and gaps between resting orders are wide, even a small market order produces a dramatic multi-tick move, while dense books absorb the same flow with a smaller adjustment. Fix: model fees, slippage and latency, and set expected slippage from your measured depth bands instead of from the chart.
- Reporting one aggregate win rate. A 2026 Backtrex backtest analyzed 1,247 liquidity-sweep trades on EURUSD and XAUUSD from 2019 through 2024 and reported a combined 53.2% win rate and 1.68 profit factor. It's a useful headline, and it's combined, so it doesn't tell you which instrument or session carried the result. Split by asset, session, spread, depth and volatility regime.
- Setting the stop a fixed tick count beyond the level without measuring depth. A Tradeify study tested 90 liquidity-sweep and stop-run events and found that a stop placed 4 ticks beyond the swept level survived none of them. Fix: size the buffer from expected slippage in the measured depth bands, so the stop doesn't fill far worse than its trigger.
Audit any backtest on four points: fills include fees and slippage, latency is modeled, results are segmented, and the sample size is stated. A test that fails any of them isn't evidence about sweeps. It's evidence about a spreadsheet.
A sweep label earns capital only after it survives your own records. Run four checks, in order, before real size goes anywhere near this setup.
- Write the rule with its fields. Level type, classification criteria, confirmation candles, stop distance, maximum position exposure and position sizing. Write the rule in one paragraph; if you can't, it isn't ready yet.
- Test it on past charts. Label each event with the three-outcome test before counting any results, so winners and losers get classified the same way.
- Repeat on paper or at small size. Log each level breach with its close, volume, spread, open interest and outcome, plus session and news context. The same setup behaves differently in a thin early-morning book than at a major exchange open.
- Apply the grouping test. Keep only rules that hold across assets, sessions, timeframes and volatility regimes.
A sweep becomes tradable knowledge once you have logged enough of them to know which version works on your market, and that takes records rather than screen time. Thrive keeps your trades beside the funding, liquidation, volume and open interest context that surrounded them, then reviews the two together so the classification, not just the outcome, is visible. Thrive Pro covers market data on the top 20 assets and starts with a 7-day free trial at Thrive, then costs $99 per month; cancel anytime before the trial ends and pay nothing. Pro+ at $199 per month adds the liquidation heatmap and the smart money and whale feed, carries no trial, and annual billing gives 2 months free on either plan.
Educational material only, not financial or investment advice. Crypto trading carries substantial risk of loss, and examples do not predict future results. Thrive publishes this article and sells the products described.